Tag Archives: Code

Code

Seattle Public Library Visualization

This is a visualization of transactions from the Seattle Public Library, taken from a dataset of over 66 million entries collected since 2005. Through this database, I was able to experiment with various methods to filter huge collections of information, attempting to extract meaningful patterns and depict them visually. Many thanks to Professor George Legrady for gaining access to this data.

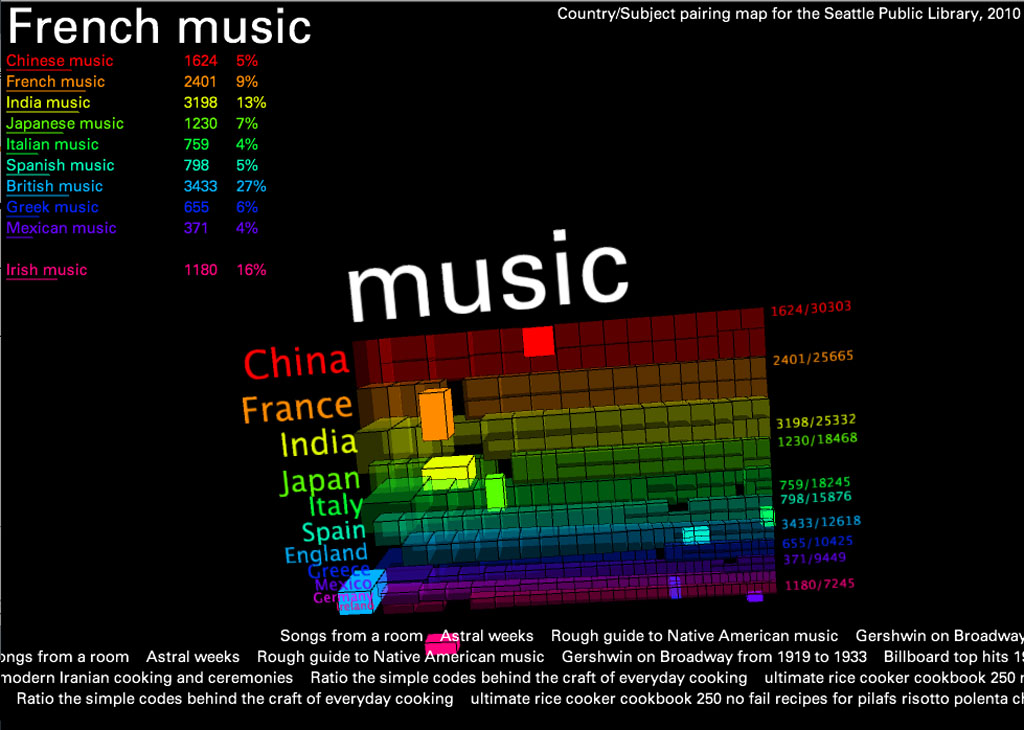
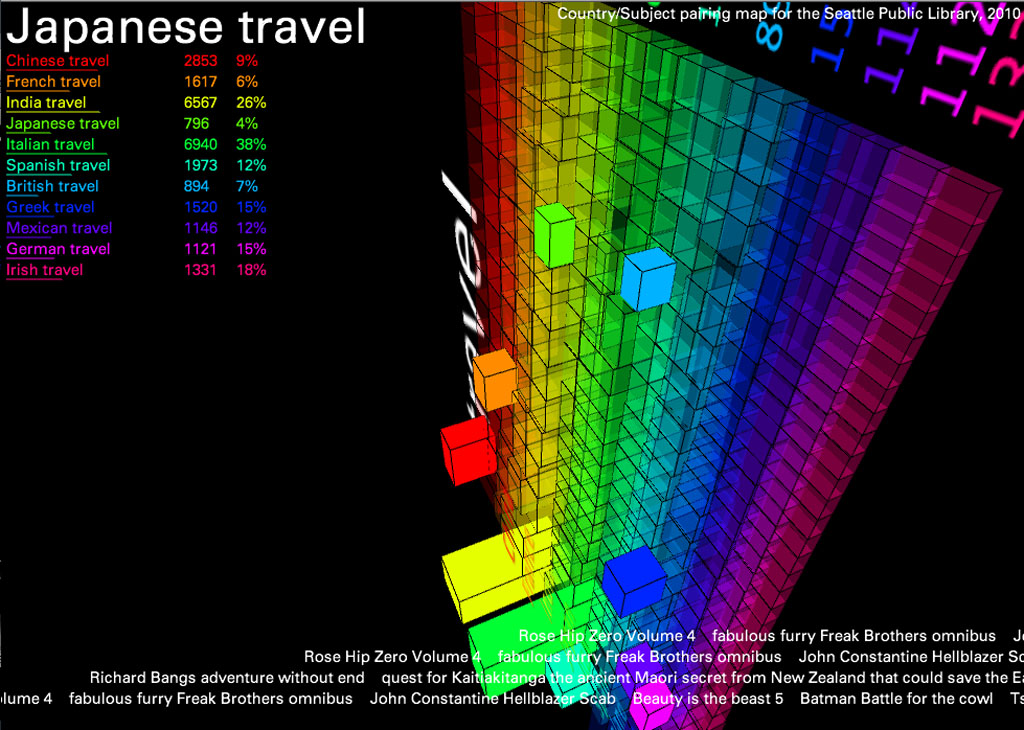
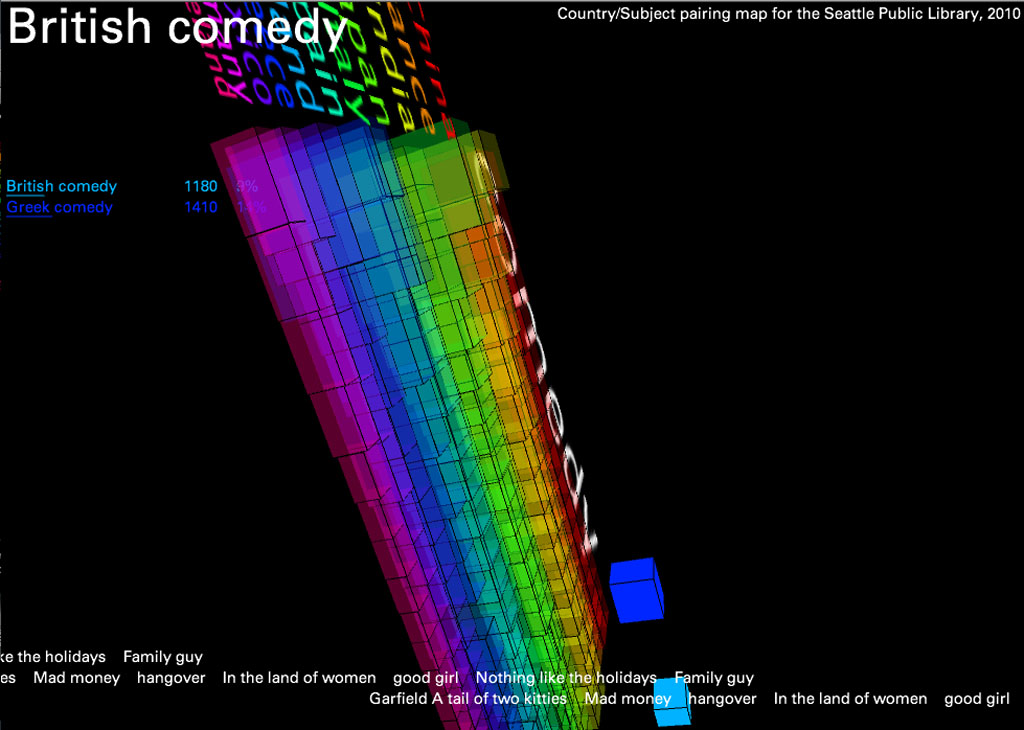
In this version, I created a 3D map of the 11 most frequently referenced countries and the words most often associated with each for all of 2010. I did this by collecting the first three subject headings for every item circulated with a title referencing a country in either noun or adjective form (for example, “china” or “chinese”). This created a large text file which I simply parsed in terms of word frequency.

The result reveals interesting trends: “war” was the word most often associated with Germany, “cooking” and “food” were important categories for every country except England and Ireland (proving the fact that no one likes British food), and “women” was one of the most words most associated with France, etc. To add another layer of information, I’ve included scrolling “trackers” at the bottom that display actual titles of items containing these subject/keyword pairs (Italian + food, etc.).

The countries are listed in order of popularity- China being first- and the 3D blocks can be read as literal representations of the volume of items checked out in each category.

Technically speaking, data manipulation and filtering was done through MySQL in conjunction with some fancy BASH scripts, and all of the visualization was done in Processing. If you’re curious, please feel free to download the source code and try it for yourself.

Code DSP

Spatial Upmixer

I sort of got obsessed with the idea of being able to take a recording of a soloist and make it sound like an ensemble. As I found out, it’s not an easy thing to do, but adding on to spatialization software written by Ryan McGee, I was able to make something that sounds pretty decent (imho).

Technically speaking, this process is called “decorrellated upmixing” and it’s much harder than just adding a bunch of small delays to a signal. In real life, no two instruments are ever playing perfectly in phase with one another, but when we try to multiply a single signal that’s basically what’s happening, so as a result we often end up with a really strange “alien” phase-cancellation effect which sounds completely unnatural. My software gets around this by all sorts of filters and randomization techniques. Still there’s much work to be done, but I was able to create some realistic ensembles as well as some interesting effects on a variety of files. If anything it might be a quick way to sneak around copyright if you want to use someone’s recording…
[audio:http://amusesmile.com/old/projects/240B/violin.mp3|titles=Bach Chaconne Solo]
[audio:http://amusesmile.com/old/projects/240B/violin_multi.mp3|titles=Bach Chaconne Ensemble]
More Examples in the full project page.

Art

Pop Montage

Every day google’s hot trends website releases statistics on the 20 most quickly rising search queries. I wrote a program that downloads this information and collects pictures of each of these items, analyzes the images, crops them based on their content, and finally arranges them into a single visual composition, leaving us with a giant daily collage.

It’s sort of a way to take a snapshot of what society cares about at a particular moment in time. When viewed in sequence, it also allows you to pick out patterns in popular culture. As you can probably guess it’s pretty bleak. Basically every day there’s inevitably a new food or type of desert, a celebrity controversy, some random sexy girl of the day, a few sports players, more celebrities, something cute like “national margarita day”, and then maybe, MAYBE toward the bottom of the list something serious like a massacre in Georgia or the Defense of Marriage Act. Hopefully I’ll be able to set this up on a server so that it automatically makes a new collage every 24 hours. People could use it as a homepage to very quickly find out what’s new in the world without having to scan the news.

Image analysis, manipulation, and montage is done in Matlab. Statistical information is taken from Google Hot Trends.

March 2, 2011:

Feb. 26, 2011:

March 1, 2011:

For more examples, check out the full project page.