Standing Waves
a multimodal, motion-capture composition in the AlloSphere
"Very Nervous System", D. Rokeby, 1982-1990
- The piece was created with three 16x16 pixel, monochromatic video cameras which were used to track human movement. This was analyzed by a group of computers and translated into sound through synthesizers controlled via MIDI.
- This setup essentially turns the user's body into a musical controller.
- The piece has gone through many technical and artistic iterations and has been installed in indoor and outdoor locations since the mid 80s.
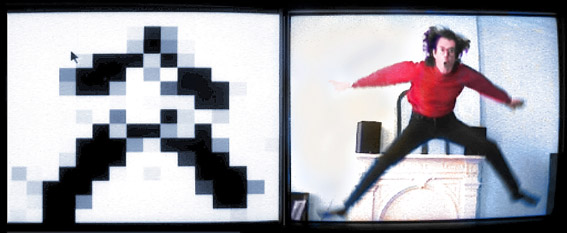
Pixel information tracked by the cameras in "Very Nervous System."
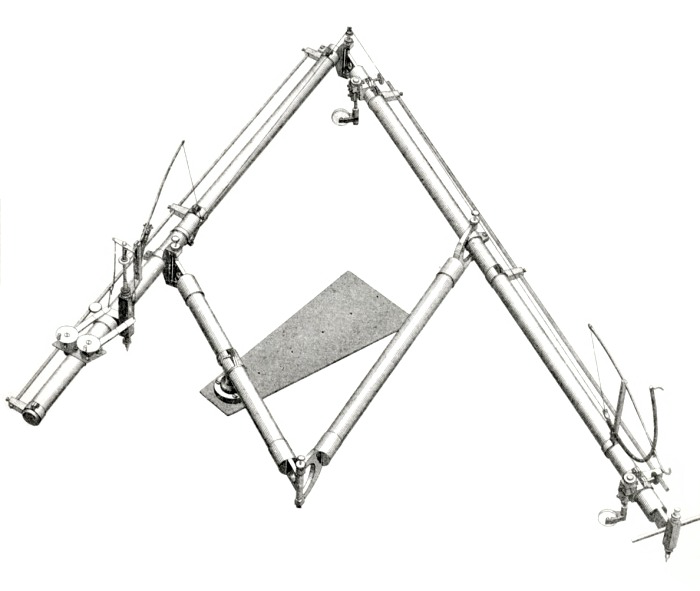
"Pantograph", J. Dickinson, 2012
“A pantograph (from Greek roots παντ- ‘all, every’ and γραφ- ‘to write’) is a mechanical linkage connected in a manner based on parallelograms so that the movement of one pen, in tracing an image, produces identical movements in a second pen. If a line drawing is traced by the first point, an identical, enlarged, or miniaturized copy will be drawn by a pen fixed to the other.”
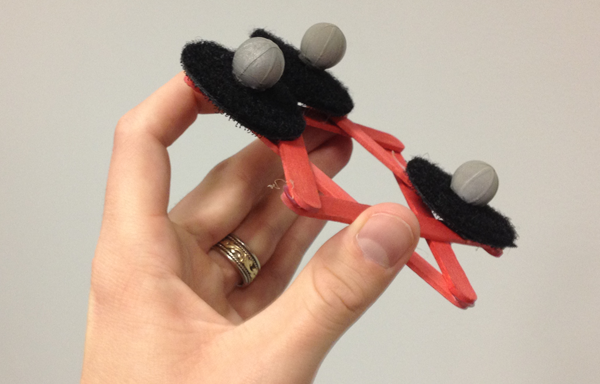
One of the custom motion-capture controllers used translate movement into sound.
"Pantograph", J. Dickinson, 2012
- "Pantograph" was composed in a two-stage process. Sounds were first generated and recorded in real time and then organized offline.
- The control system enabled the “exploration” of sounds spatially, combining Allocentric and Egocentric mapping strategies:
Allocentric: Relating to spatial representations: linked to a reference frame based on the external environment and independent of one’s current location in it. For example, giving the direction as “north,” as opposed to “right” (egocentric).
- A dual-controller interface was used to control granulation parameters. Axis of movement was used as a way in which to divide control between three granulators simultaneously.
- Because of this division of axes, simple 3D motion leads to complex envelopes and parameter relationships.
- Three control modes were created, each having a unique sonic characteristic. I call them the "Drone," "Phrased," and "Hissing" modes respectively.
"Pantograph", J. Dickinson, 2012
1. "Drone" mapping system:
| Parameter | Control |
| Sample Location | x1 |
| Grain Length | abs(y1 - y2) |
| Grain Period | abs(z1 - z2) |
This employs the most simple mapping strategy, outputting only a single grain stream. The sample start location of this output stream is determined by the (room stationary) x-dimensional position of the first controller, the grain length is determined by the y-distance between the two controllers, and the frequency of the train~ object triggering the stream is inversely proportional to their z-distance.
"Pantograph", J. Dickinson, 2012
2. "Phrased" mapping system:
| Parameter | Control |
| Stream 1 Amplitude | abs(x'1) |
| Stream 2 Amplitude | abs(y'1) |
| Stream 3 Amplitude | abs(z'1) |
| Stream 1 Sample Location | x2 |
| Stream 2 Sample Location | y2 |
| Stream 3 Sample Location | z2 |
| Stream 1 Grain Length | abs(x1-x2) |
| Stream 2 Grain Length | abs(y1-y2) |
| Stream 3 Grain Length | abs(z1-z2) |
This style is much more subtly expressive because all three streams are utilized, each being controlled by one of the three axes (x, y, z). Velocity along each axis is directly coupled to the amplitude of its corresponding stream, so the performer can “mute” each of them individually by freezing movement in one direction. This is an “opt-in” (fading) interface because stillness will always result in amplitude values of zero and therefore complete silence.
"Pantograph", J. Dickinson, 2012
3. "Hissing" mapping system:
| Parameter | Control |
| Stream 1 Playback Speed | abs(x1-x2)*100.0 |
| Stream 2 Playback Speed | abs(y1-y2)*200.0 |
| Stream 3 Playback Speed | abs(z1-z2)*400.0 |
The “hissing” mode is essentially an extension of the phrased mode where the playback speed of each stream is multiplied by a factor of the absolute distance between each controller on each axis, giving it a strong formant quality. Absolute distance on the x-axis set the playback speed of the first stream, distance on the y-axis set the playback speed of the second stream, and distance on the z-axis set the playback speed of the third stream. Values are scaled so that a distance of 0.0 to 1.0 meters would correspond to playback speeds of 0 to 100 for stream 1, 0 to 200 for stream two, and 0 to 400 for stream three. These speeds are set in multiples of the original playback rate, so a playback speed of 100 would be 100 times as fast as the original.
"Pantograph", J. Dickinson, 2012
- Spatialization was also controlled through the axis of movement. Each "performance" was output through an 8-channel setup. Three of the stereo pairs were assigned to the X, Y, and Z axis respectively, and the fourth pair played a summed output of the other three. Each speaker pair was placed along one of the transLAB's 4 walls.
"Space Potentiometer", P. Henry, 1951.
- Experiments with motion-capture spatialization date back at least as far as 1951 when Pierre Henry and Pierre Schaeffer used a device called the “Space Potentiometer” to control the location of sounds projected in the piece Symphonie Pour un Homme Seul (Symphony for One Man Alone).
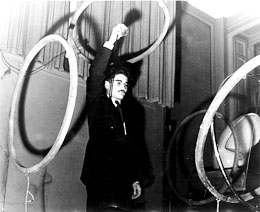
Pierre Henry, 1951
"...two loudspeakers were placed at the front right and left sides of the audience; two other loudspeakers completed the distribution – one was place at the rear, in the middle of the hall and another also placed at the rear, but over the audience. The system was controlled from the stage, with the ‘relief desk’, which consisted of two circular electro-magnets placed perpendicularly – the two hands of the performer moving in and out the circles, or towards left and right and thus controlling the spatial intensity and the localization of the sounds" [Teruggi].
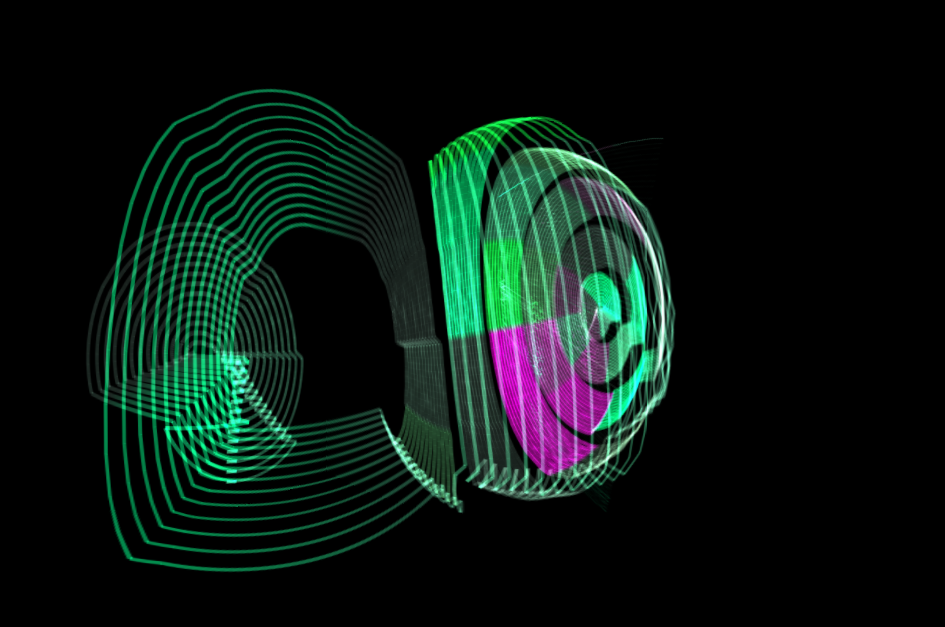
"Standing Waves" transLAB Installation, J. Dickinson, 2012
- The "Standing Waves" transLAB installation is a prototype of what would later evolve into the AlloSphere piece.
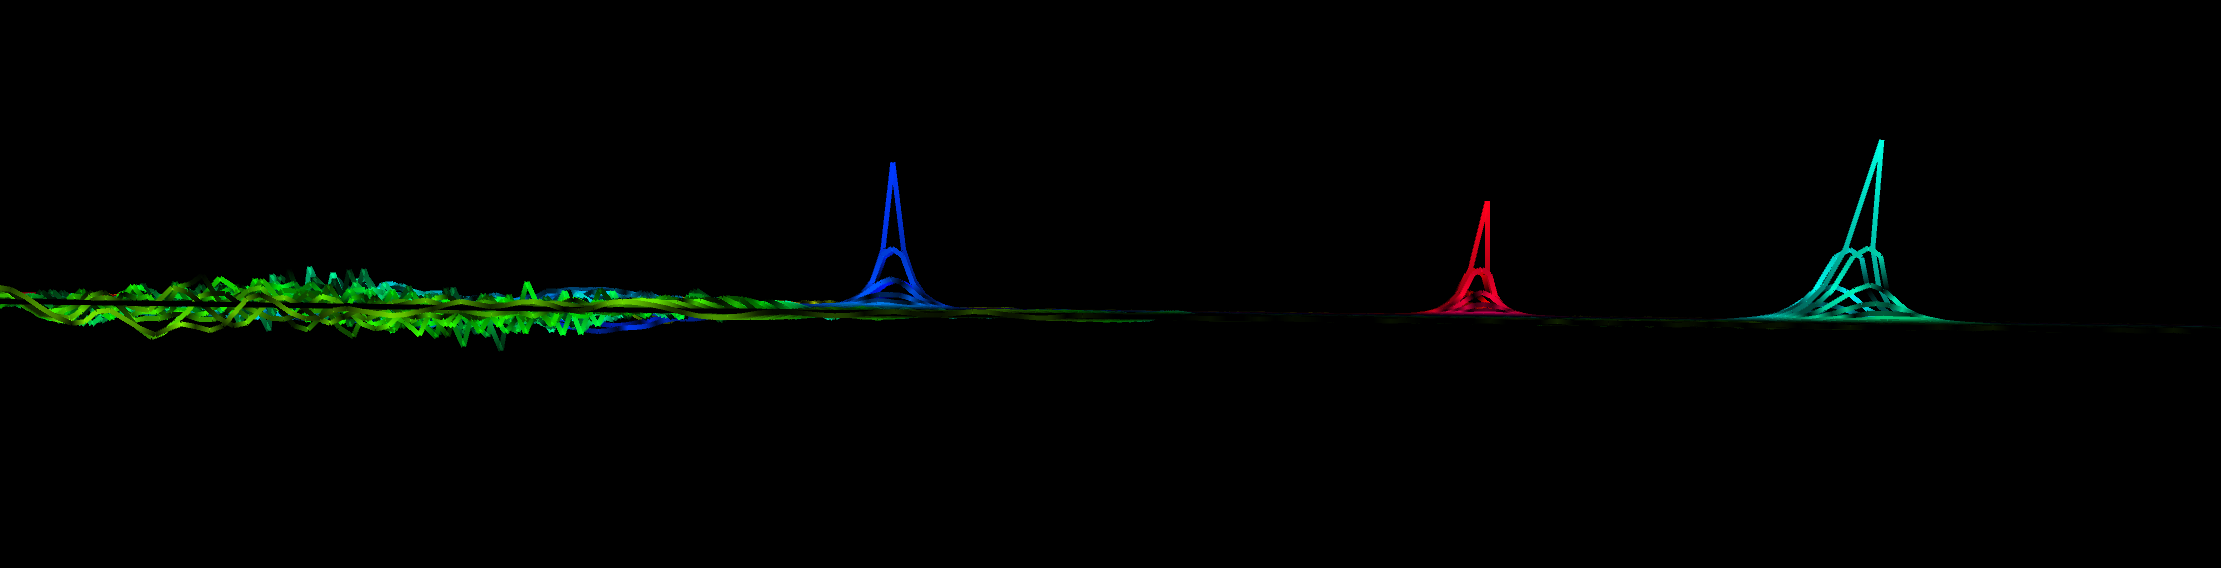
- It presented a visual and sonic perceptualization of a 2D wave propagation network, with which up to three users could interact through motion capture controllers.
- The position of each controller determined the location of an energy spike in the wave network. When the controllers remained still, the system reached a state of equilibrium, leaving only three "standing" wave spikes. Any movement of the controllers would cause waves to propagate visually.
- An array of oscillators “beneath” the wave field were made louder and softer depending on the height of the wave at their respective locations, thus sonifying the system.
"Standing Waves" transLAB Installation, J. Dickinson, 2012
- The floor of the room was mapped to the dimensions of the 2D field in a one-to-one relationship. Interaction with the controllers was meant to be understood intuitively, through the metaphor of “dragging” one’s hand through a simulated pool:
“The success or failure of a live computer music instrument is determined by the way it maps performers’ control gestures to sound. We believe that the best mappings are informed by metaphors...” [Wright, et al.]
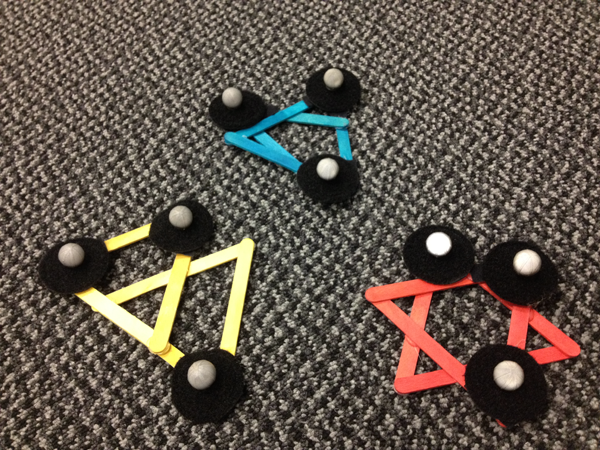
Red, yellow, and blue controllers used to interact with the piece.
The AlloSphere
"The AlloSphere is a large sphere, ten meters in diameter, made of perforated aluminum, that is designed to provide multimodal representations of large-scale data in a fully immersive, 3D environment"
- A group of 12 projectors is used to display visuals around the full top hemisphere of the room to about 20 degrees below its horizon.
- Audio is projected through a 54.1 channel sound system, installed in three rings around the AlloSphere's perimeter with the addition of a subwoofer beneath its base.
- User interaction takes place on top of the sphere's bridge.
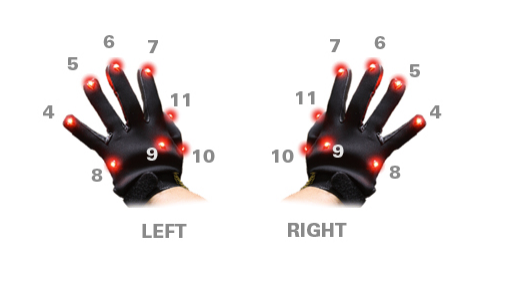
Phasespace Tracking System
- Interaction is facilitated through a commercially available motion-capture tracking system from Phasespace™.
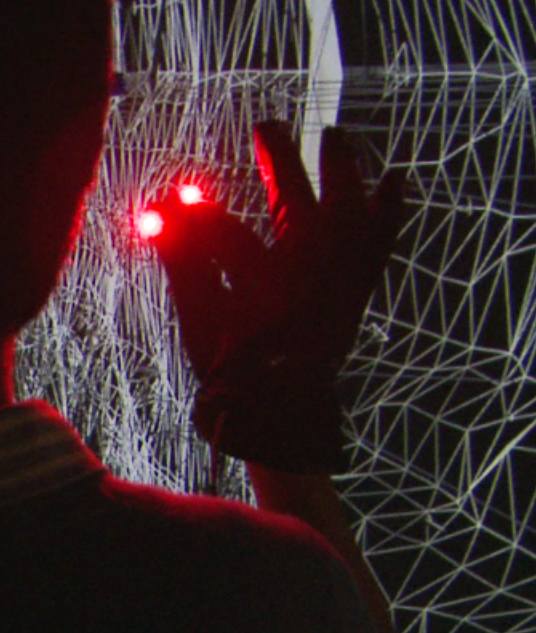
- Two gloves are used to monitor user movement, each of which are equipped with 8 active-LED markers. These are tracked in space through 14 overhead cameras positioned around the outside of the AlloSphere screen.
- Batteries are attached to each arm with wrist bands in order to make movement as unencumbered as possible.
Phasespace Tracking System
- Problem: occlusion often “hides” markers for a number of frames, causing a sudden break in the user's interaction with the system. This is a potential issue for optical tracking systems in general.
- In practice, the centroid, or central position of the hand is much more reliable than using the individual positions of each marker. This is calculated by taking the arithmetic mean of the marker positions at each frame (at a rate of 120Hz).
- How open or closed the user's hand is, referred to as “spread” can be calculated by taking the markers' average absolute deviation (the average distance away from the centroid).
- Pinches between each finger and the thumb can also be detected and used as a trigger or switch.
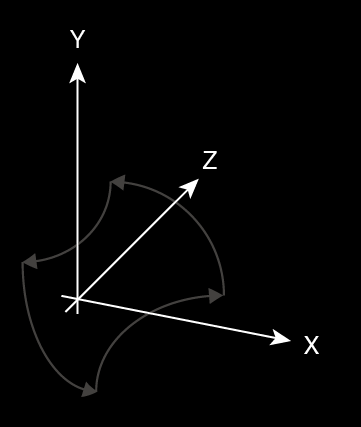
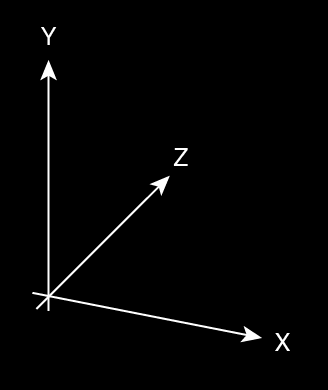
Definition of Axes
Definition of Axes in the AlloSphere:
- X-axis runs the length of the bridge
- Z-axis runs perpendicular to it along the floor
- Y-axis runs up and down in relation to gravity
The Wave Equation
- The engine that drives "Standing Waves" is a 100 node by 100 node, two-dimensional wave propagation graph connected at each end in a toroidal structure. The height of the wave at each location is calculated in discrete time steps using the finite difference method (FDM), given by the following formula:

- "c" is a dampening coefficient, referred to here as "resonance." A higher c value corresponds to a longer impulse response in the system. Values between 0.93 and 0.98 were used for different effects throughout the piece.
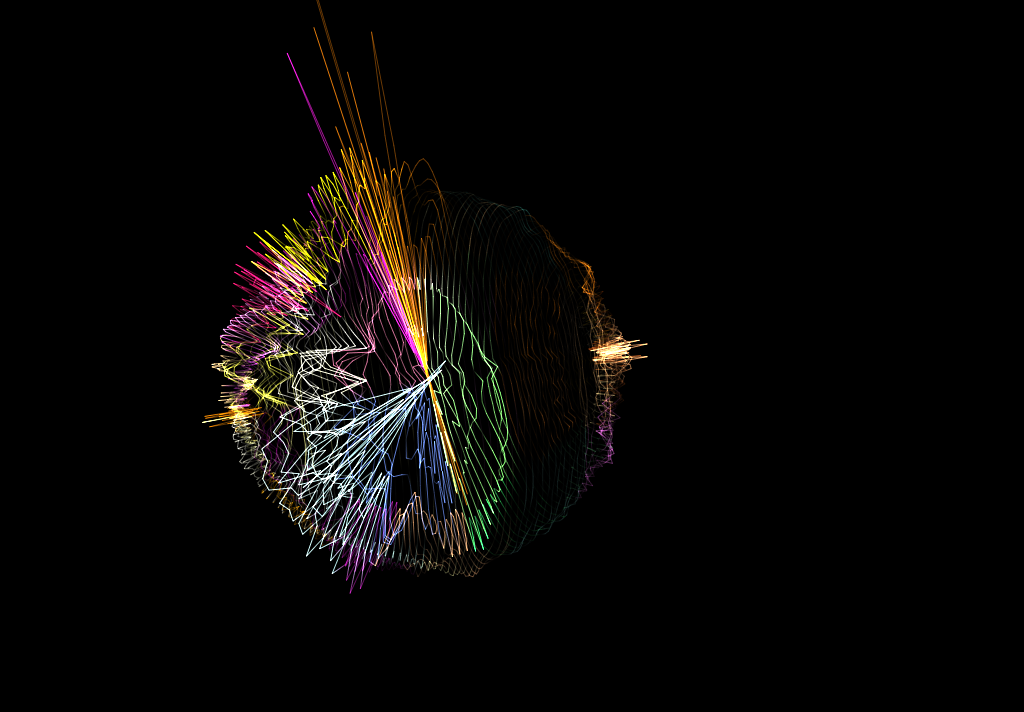
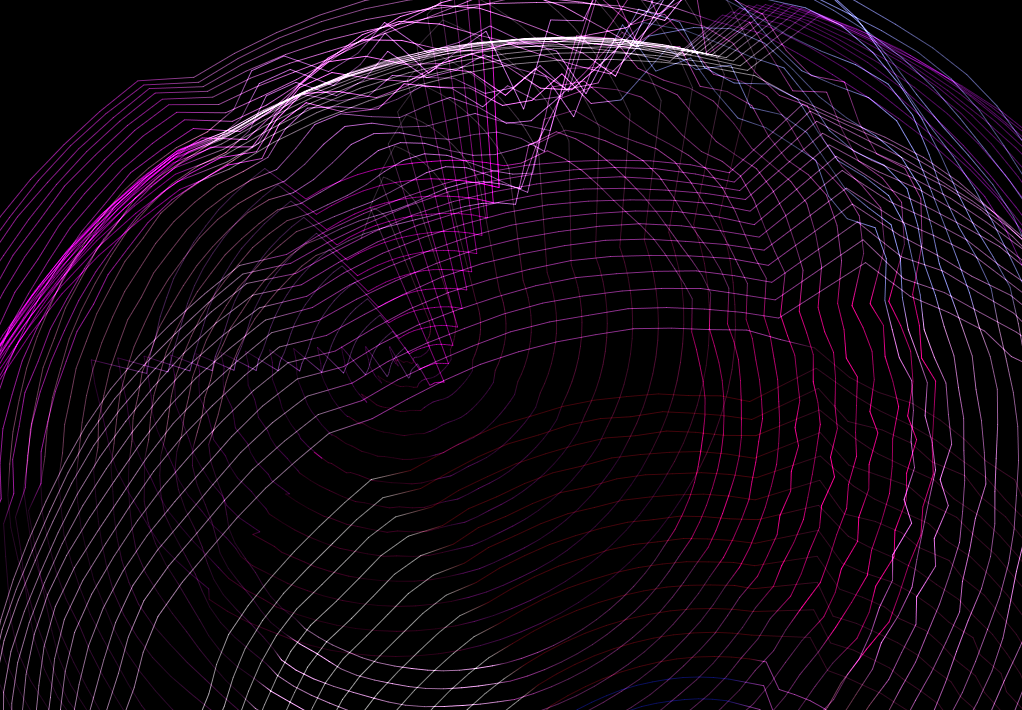
Visualization
Sonification
- The wave propagation graph is sonified through the use of an additive synthesis network distributed in two dimensions.
- 54 Sine-tone oscillators are imagined as “buoyed” to the wave-field, and the amplitude of each oscillator is set according to the absolute height of the field at its location.
- As energy propagates throughout the system amplitudes rise and fall with each wave, thus sonifying the data.
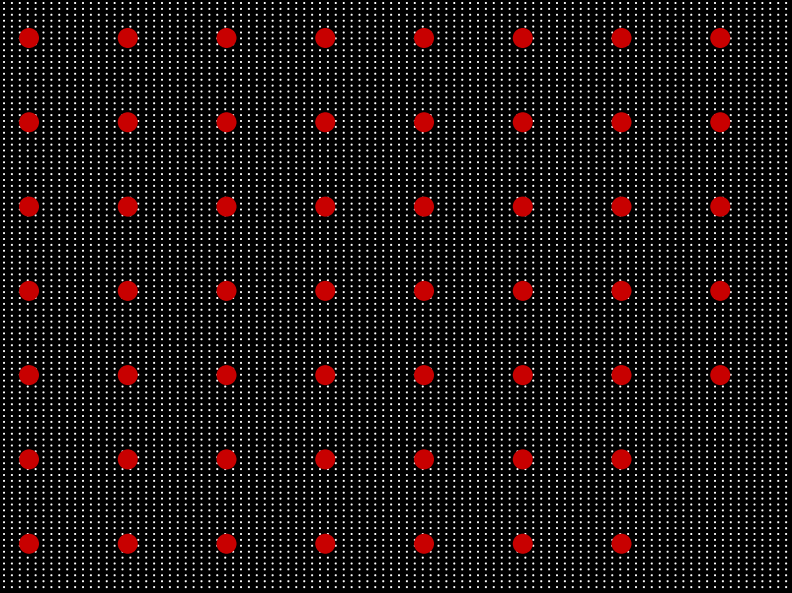
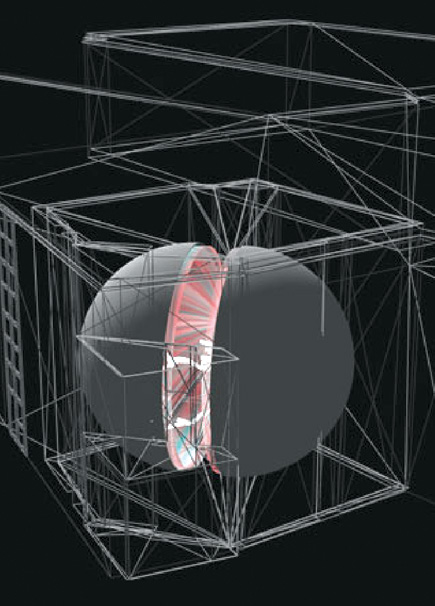
A diagram of the additive synthesis network: white dots represent the wave field nodes, red dots represent the sine wave oscillators.
Spatialization
- Each oscillator is assigned to one of the 54 speakers present in the AlloSphere, providing a simple but effective method of spatialization.
- As energy moves throughout the field, sound intensity shifts within the room.
- Oscillators in close proximity on the wave graph are generally output through neighboring speakers, however the conversion from a 2D grid to a three ring speaker array prevents a direct spatial mapping through this technique.
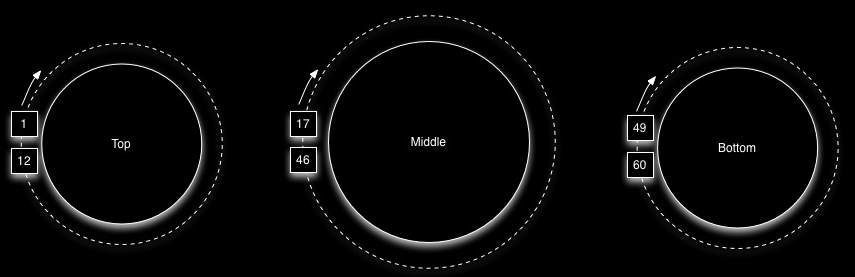
Three rings of speakers in the AlloSphere.
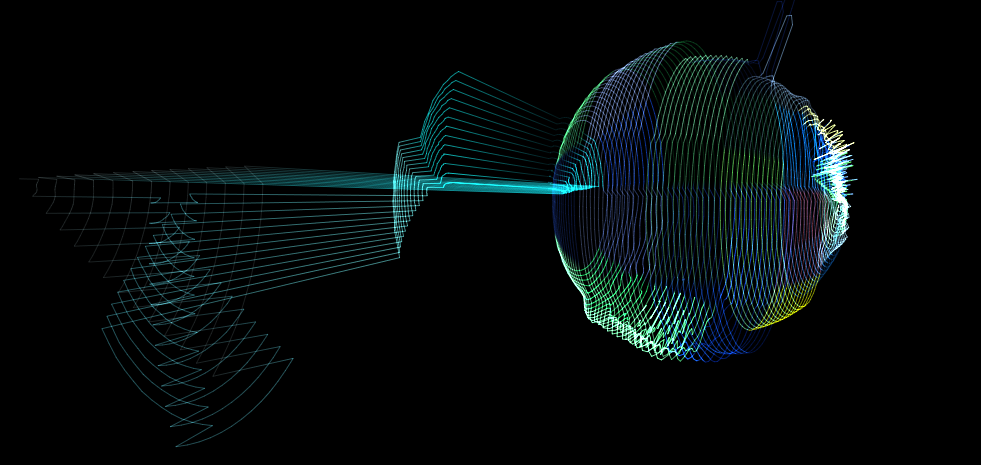
Audio-Visual Correlation
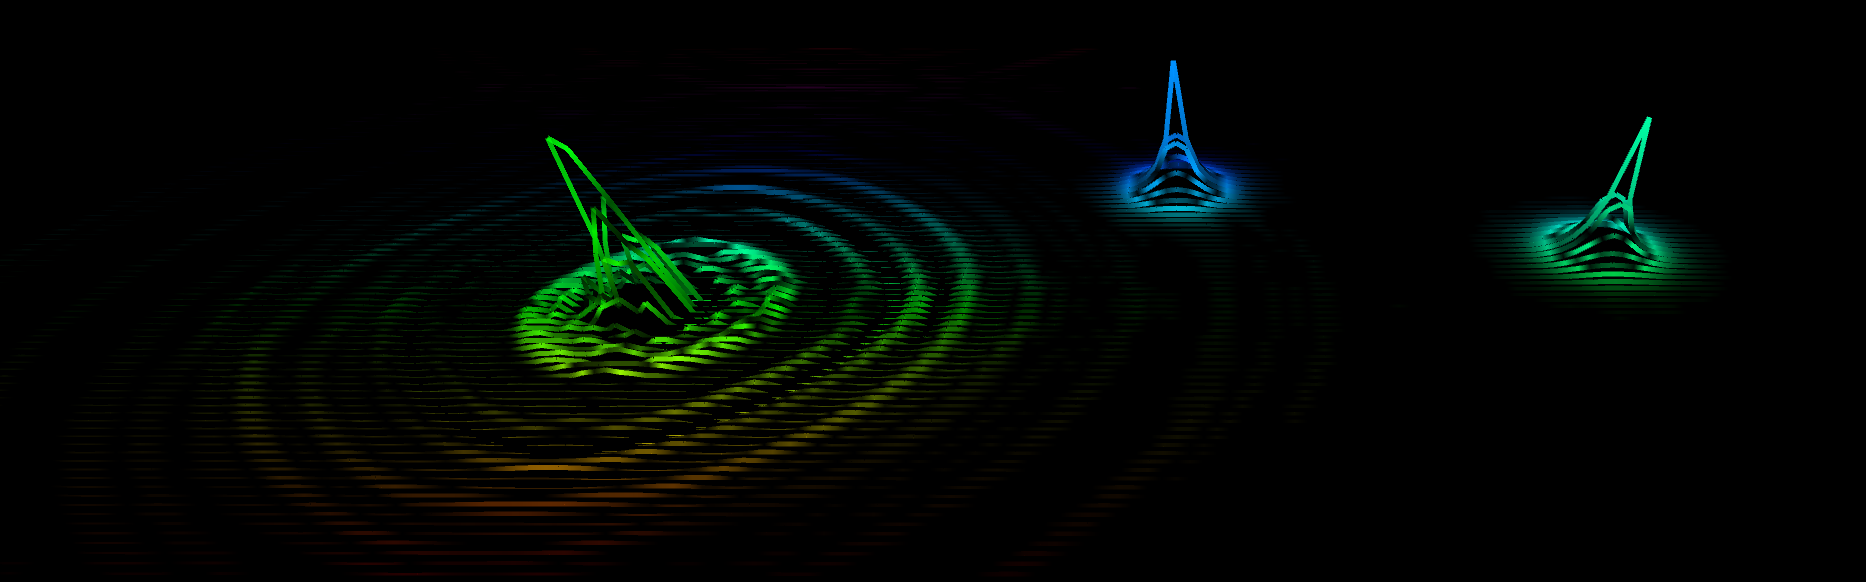
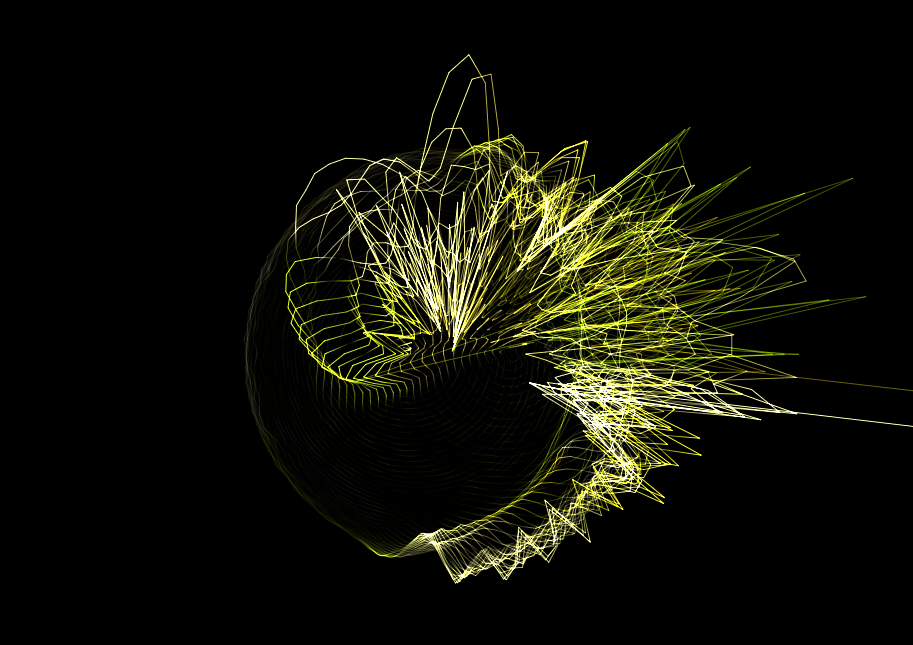
- During movements II and V, the shape of the sphere is warped and pushed outward according to each of the spectral bins' amplitudes, forming a 3D amplitude map.
- The hue of each section of the wave field is calculated according to the frequency of its assigned oscillator, with lower frequencies corresponding to blue and higher to red.
- Harold Cohen's color selection algorithm is used to pick saturation and lightness values.
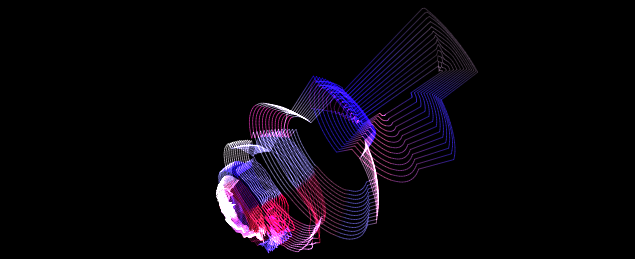
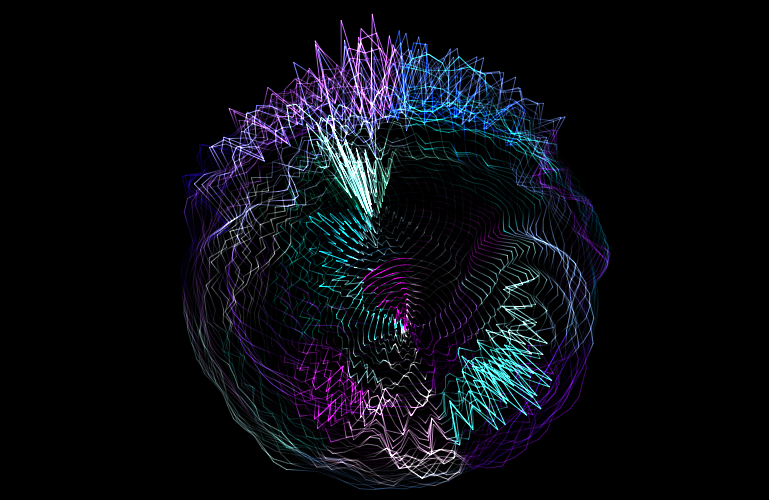
Screenshot of movement V: spectral bin amplitude values affect the shape of the sphere and frequency values affect its color.
H. Cohen's Color Selection Algorithm
- Harold Cohen's coloring formula is a heuristic method by which to probabilistically control randomly generated color saturation, and lightness values.
- It has been used extensively by his AARON algorithmic painter, and is summarized in detail in the essay "Color, Simply," 2006.
- Three normalized number ranges are chosen, corresponding to low, medium, and high values. For example 0.15-0.35 (L), 0.4-0.65 (M), 0.8-1.0 (H)
- These are set up in a 3x3 matrix, each corresponding to a possible saturation-lightness pairing. For example, a low-low (LL) pairing would provide both saturation and lightness values chosen randomly from within the low range
- During initialization, a probability value is assigned to each of the 9 pairing possibilities inside of this matrix. Cohen suggests only using 2-3 of them per composition, for example: 20%-LL, 40%-HL, and 40%-MH
- When a new color is desired, one of these range pairs is selected based on its assigned probability, and then a specific saturation-lightness pair is chosen randomly from within each of the selected pair's ranges.
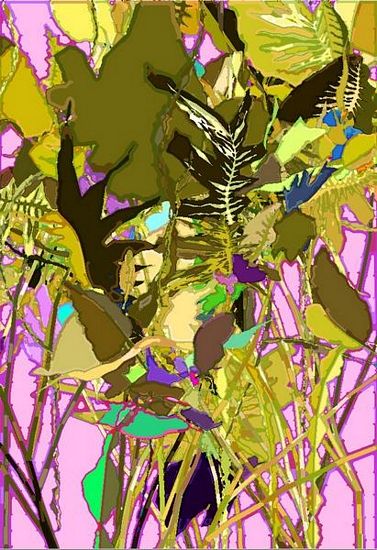
Movement I: Verbena
The first movement begins with the virtual camera placed directly in the center of the sphere. Complete darkness opens up into lush harmonies of sound and color using the song "Verbena Tea With Rebekah Raff" by Teebs as the driving audio file. As the movement progresses, the bounds of the camera slowly widen, allowing the audience to see the sphere's structure from outside.
| Sound file | "Verbena Tea with Rebekah Raff" by Teebs from Collections 01, 2011 |
| Visualization Mode | Non-warped, dynamic alpha |
| Spectral frames | Triggered by acceleration spikes |
| Wave field excitement | Glove acceleration |
| Virtual Camera | Initialized near the center of the sphere Acceleration spikes trigger camera movement As the piece goes on, the camera boundaries expand |
| Wave resonance | Medium-low |
Movement II: Blue in Green
During the second movement the sphere is warped according to the amplitudes of each spectral bin. Alpha values are all fixed to 1.0 to enable the viewer to see the underlying structure of the sphere. Glove acceleration is used to trigger changes in rotation.
| Sound file | "Blue in Green" from Kind of Blue, 1959 |
| Visualization Mode | Warped by amplitude, fixed alpha |
| Spectral frames | Triggered by acceleration spikes |
| Wave field excitement | Glove acceleration |
| Virtual Camera | Constrained to the center of the sphere Acceleration triggers movement and rotation |
| Wave resonance | Medium |
Movement III: Saturn
The third movement creates a steady, even tempo as the progression of spectral frames is controlled by a fixed clock. The audio file used in this section is a recording of the fifth movement of Gustav Holst's The Planets suite “Saturn: the Bringer of Old Age.” Saturn, or Chronos, the god associated with the passage of time seemed like an apt subject for this tempo-driven portion of the piece. During this section, the user's hand position directly controls the placement of the virtual camera, so he/she can navigate by changing positions within the room.
| Sound file | "Saturn" from Gustav Holst's The Planets, 1916 |
| Visualization Mode | Warped by amplitude, fixed alpha |
| Spectral frames | Triggered by acceleration spikes |
| Wave field excitement | Glove acceleration |
| Virtual Camera | Glove position |
| Wave resonance | Medium |
Movement IV: Neptune
During the fourth movement, energy peaks are quantized into discrete impulses triggered by large acceleration spikes. This effectively creates small “drops” in the wave field whenever the user makes a quick movement. Because no energy is generated when the user remains still, this mode has the potential to be much quieter and subtle than the others. If the user allows the waves to die-down, the entire space will fade to darkness and silence. Resonance is set to high, to emphasize the reverberant nature of the system.
| Sound file | "Neptune" from Gustav Holst's The Planets, 1916 |
| Visualization Mode | Non-warped, dynamic alpha |
| Spectral frames | Triggered by acceleration spikes |
| Wave field excitement | Single Impulses triggered by acceleration spikes |
| Virtual Camera | Initialized near the center of the sphere Moves and rotates very slowly |
| Wave resonance | High |
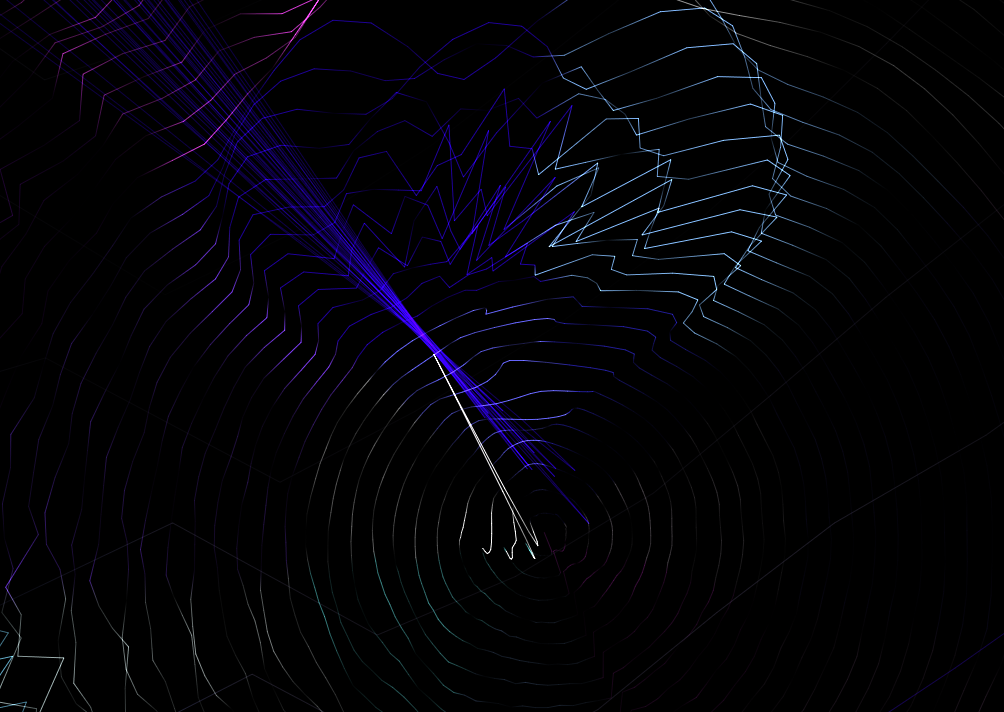
Movement V: Moonlight
Visualization is a main focus of the fifth movement. The sphere is warped by the amplitudes of the spectral bins as in the second section, however the camera is not constrained to the sphere's center, so the audience is able to get a better view of the overall shape. The virtual camera is controlled directly. A constant energy peak is created at the location of each hand.
| Sound file | "Moonlight Becomes You," 1958 by Booker Little |
| Visualization Mode | Warped by amplitude, fixed alpha |
| Spectral frames | Triggered by acceleration spikes |
| Wave field excitement | Constant peaks at the location of each hand |
| Virtual Camera | Glove position |
| Wave resonance | Medium-low |
Questions