Category Archives: Code

Art Code

Selected Algorithmic Drawing Experiments

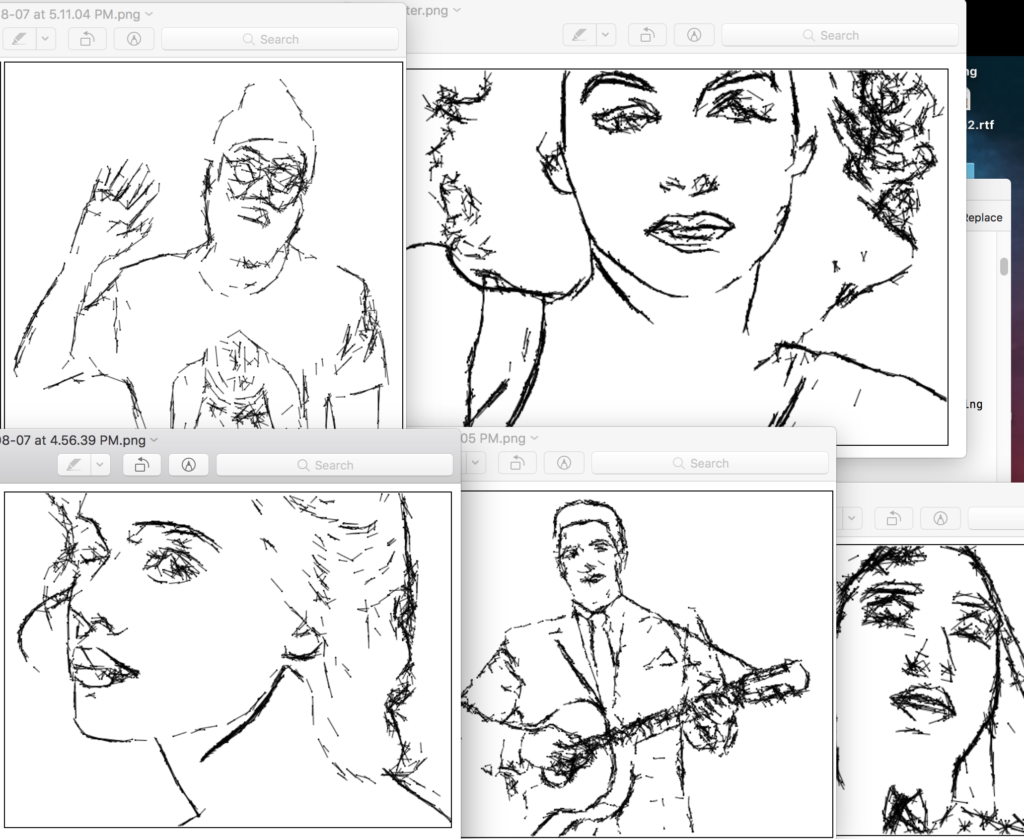
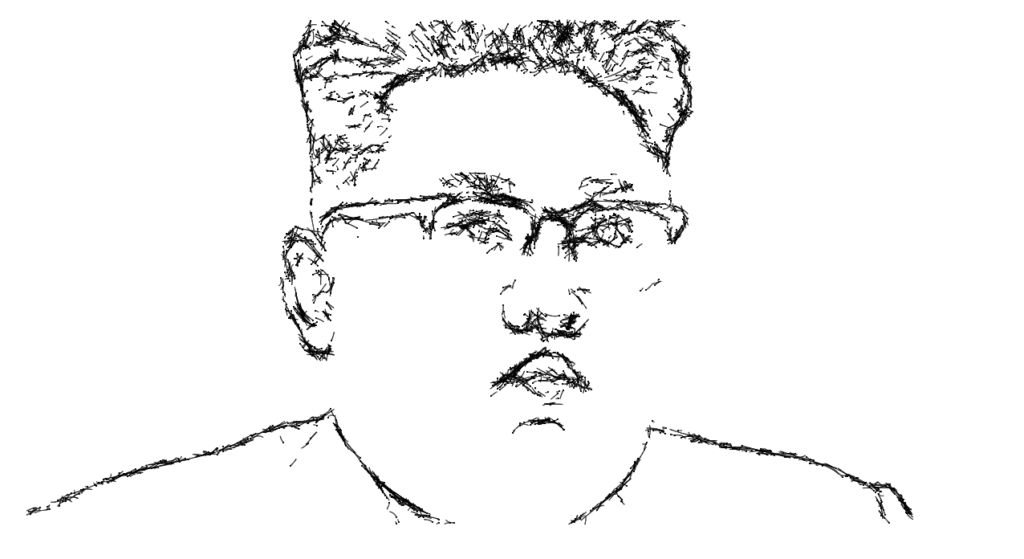
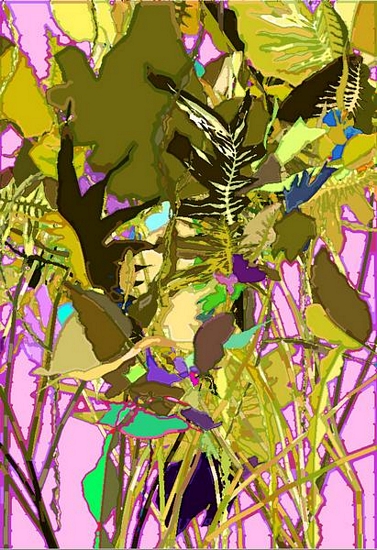
For the past many years I’ve tinkered with various algorithms to take a color photograph and convert it into a line drawing. Unlike other “style transfer” or pencil effects, these are actually made up of individual strokes and can therefore be drawn with a pen plotter or similar device. Some of the more advanced versions even contain simple logic for hatching and cross-hatching in order to produce shading in a technique similar to a real human artist. Thus far, I’ve only used heuristic computer vision approaches, however I hope to one day make use of a bit of machine learning to improve the results aesthetically.

drawingAlgos2

kim


Art Code Music

Virtual Reality Music Visualization

13389153_10153545417151078_2109466568_o

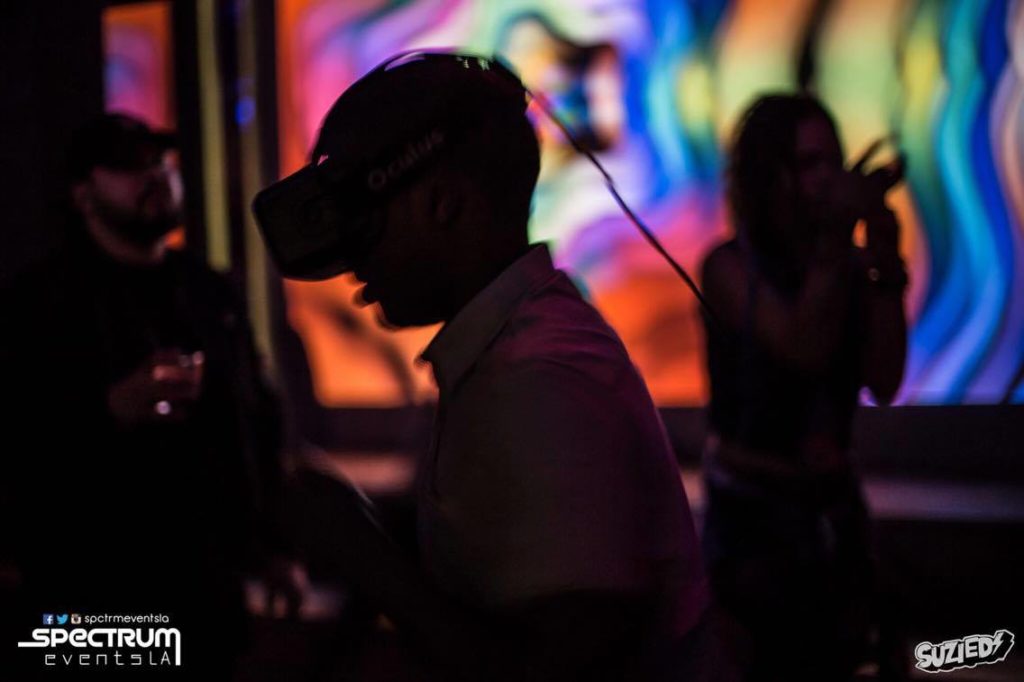
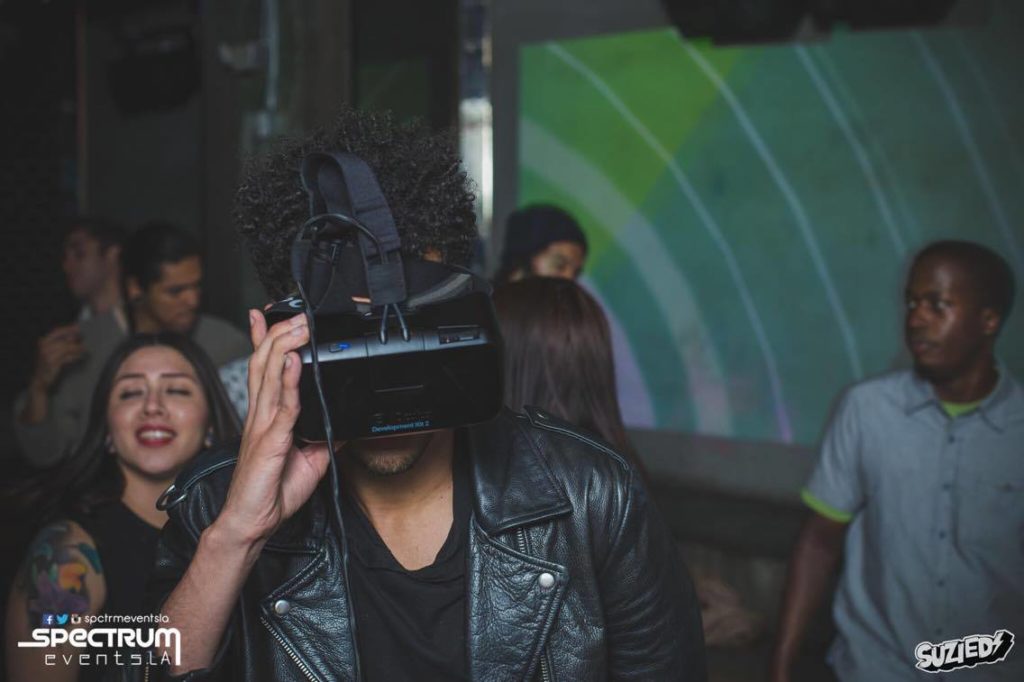
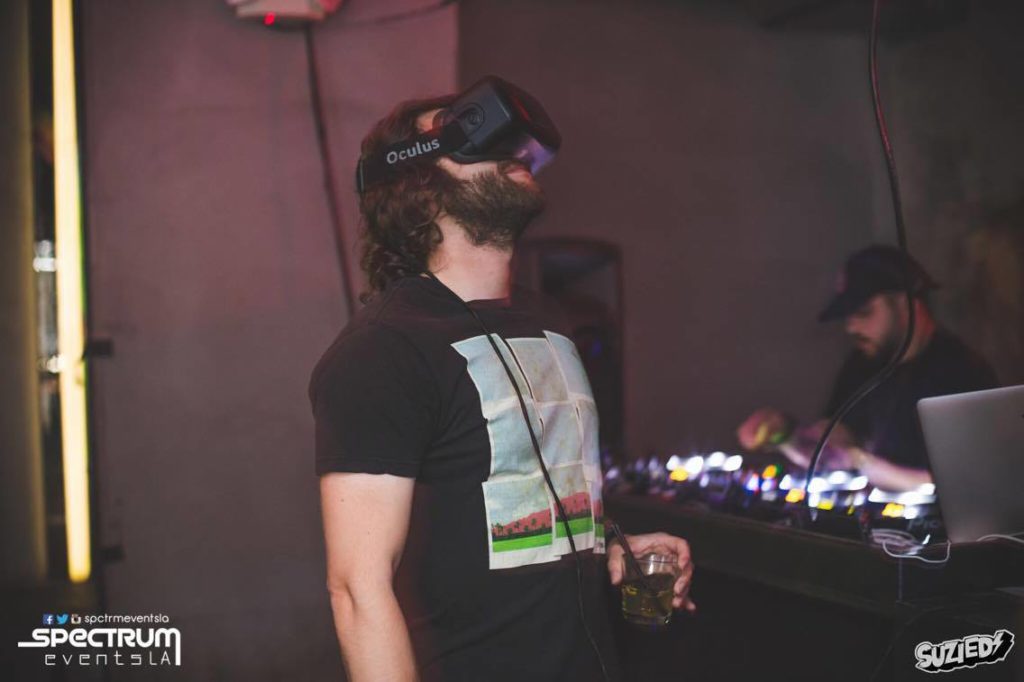
Under the name “Echobit,” Brian Hansen and I have been performing immersive VJ sets and audio-visual experiments using the Oculus Rift. We apply audio feature extraction and MIR techniques in order to create rich, interactive visuals. Users are able to explore visual worlds while they react to musical material in real time. The visuals are also projected on the wall so that all audience members can all take part in the experience.

I believe it’s the first application of Virtual Reality technology as applied to VJing and music visualization in general.

It is built in OpenFrameworks using a custom system for generating audio-reactive geometry and GLSL shaders.

13405733_10153545417126078_329967991_o

13383837_10153545417091078_1576806256_o

13410685_10153545454681078_2133745267_o

13396857_10153545417206078_607676417_o

Art Code

Interactive Installation for SB Museum

DSCF1428_straigt

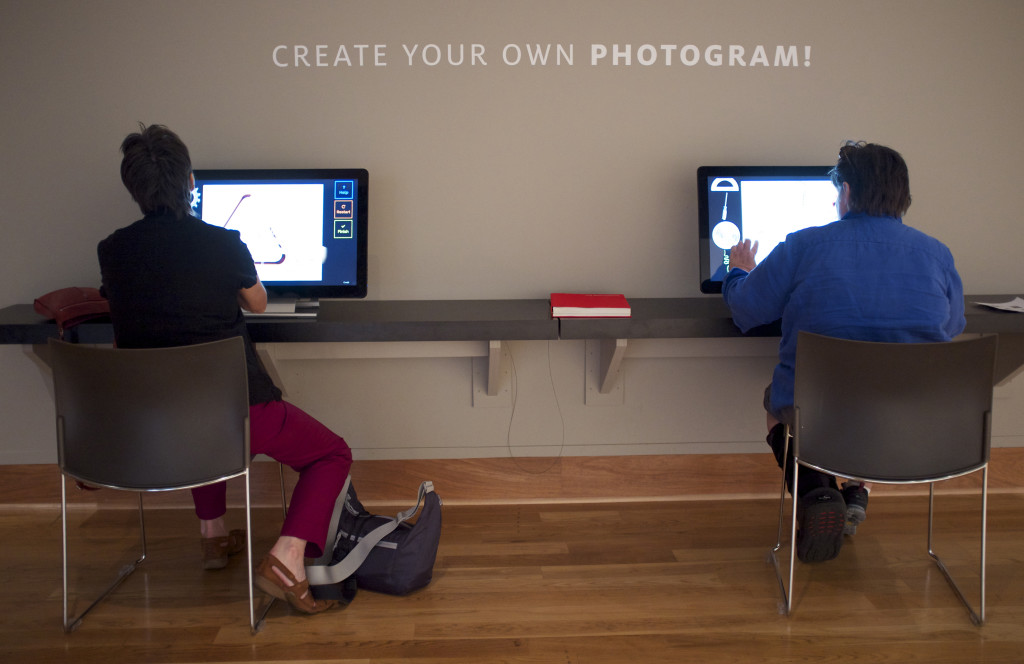
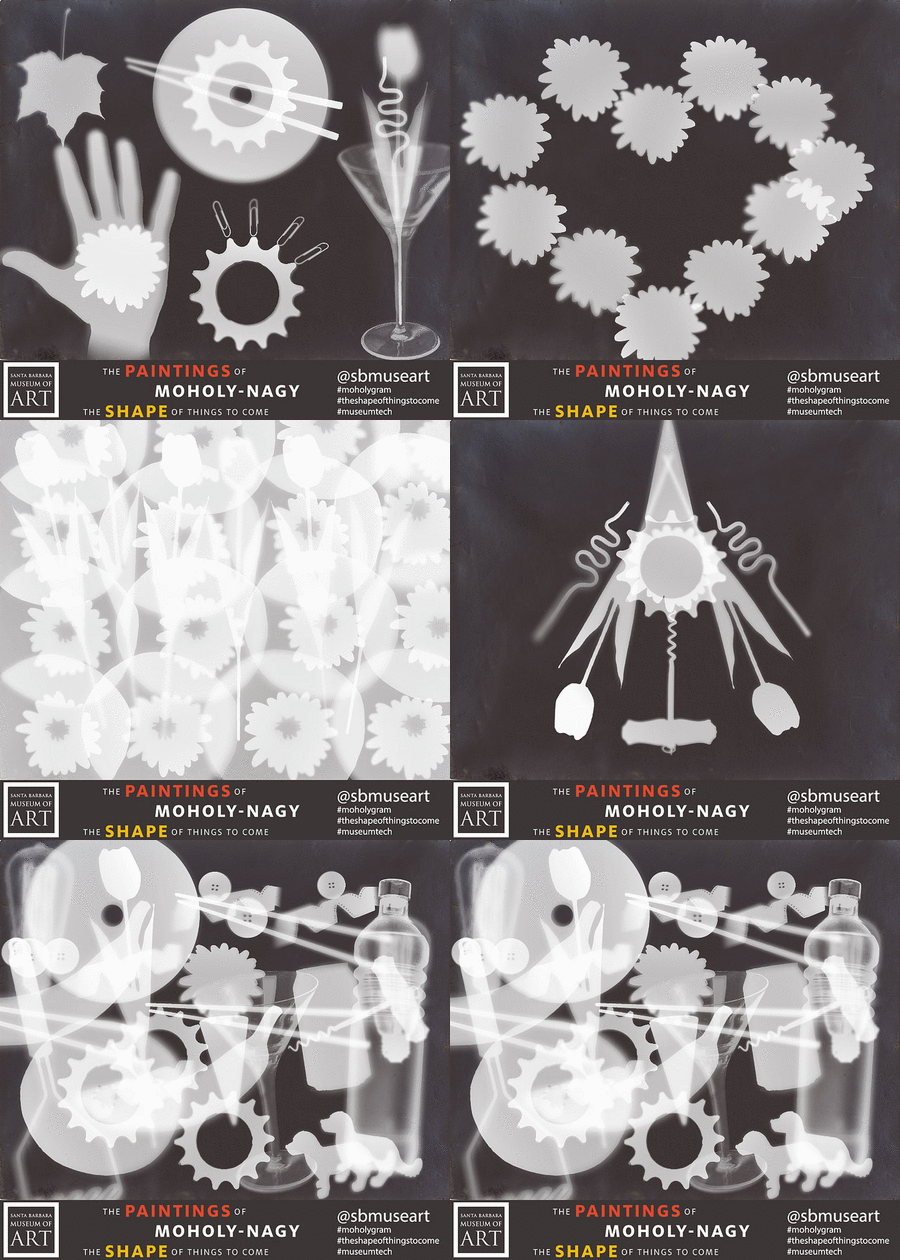
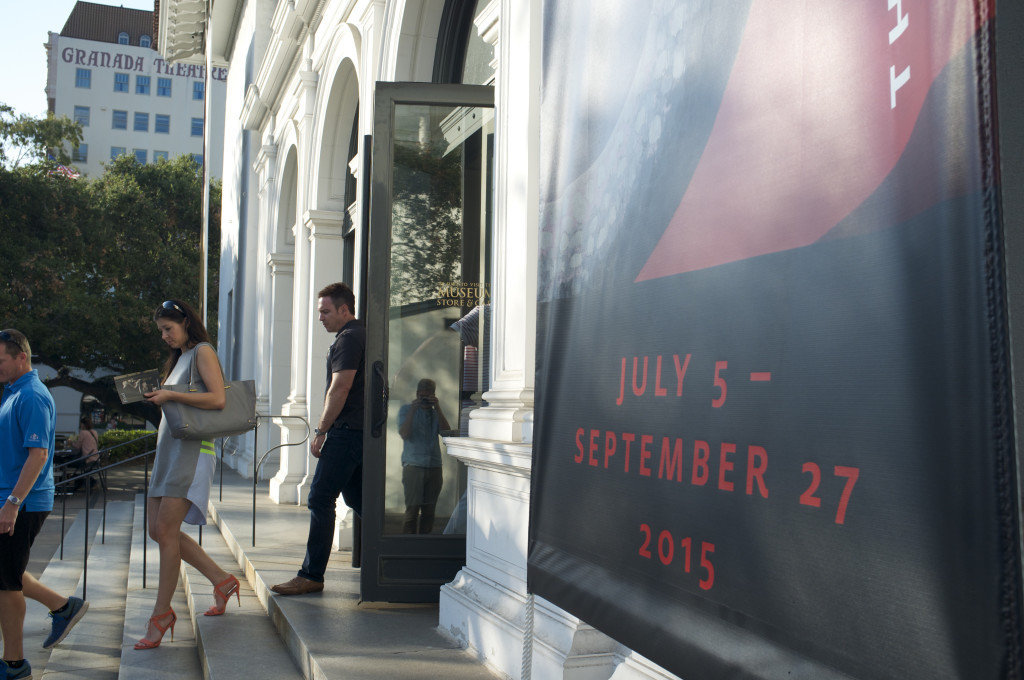
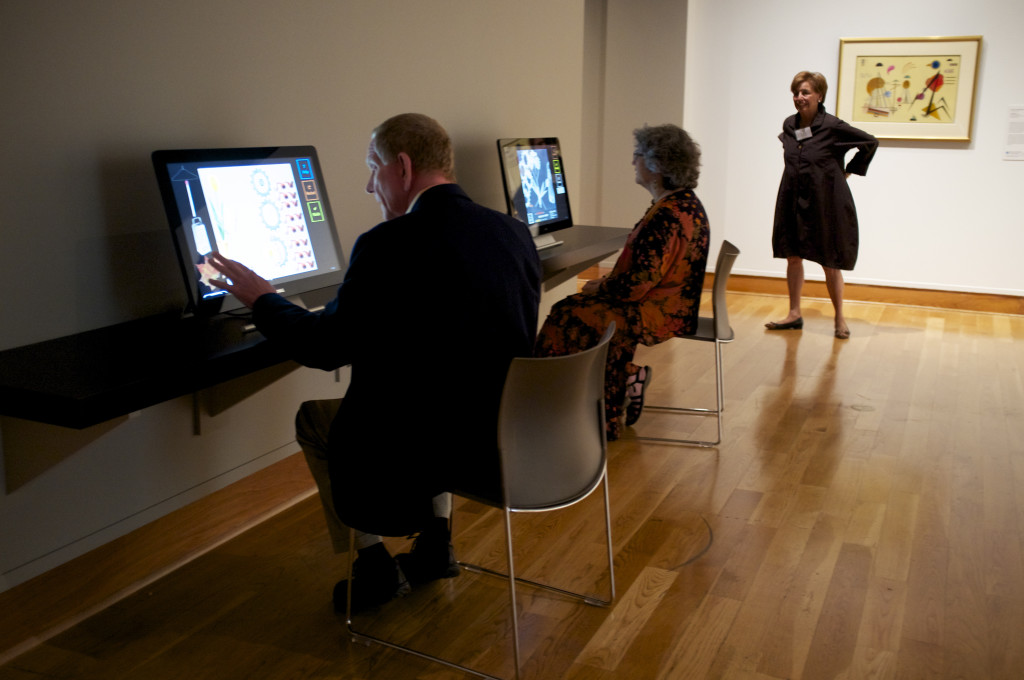
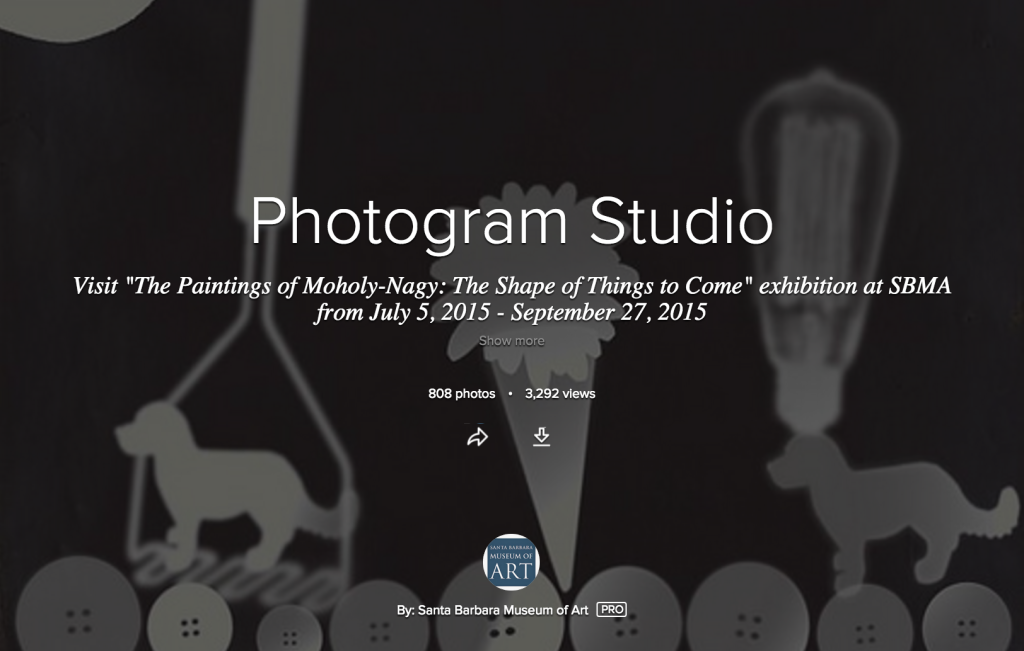
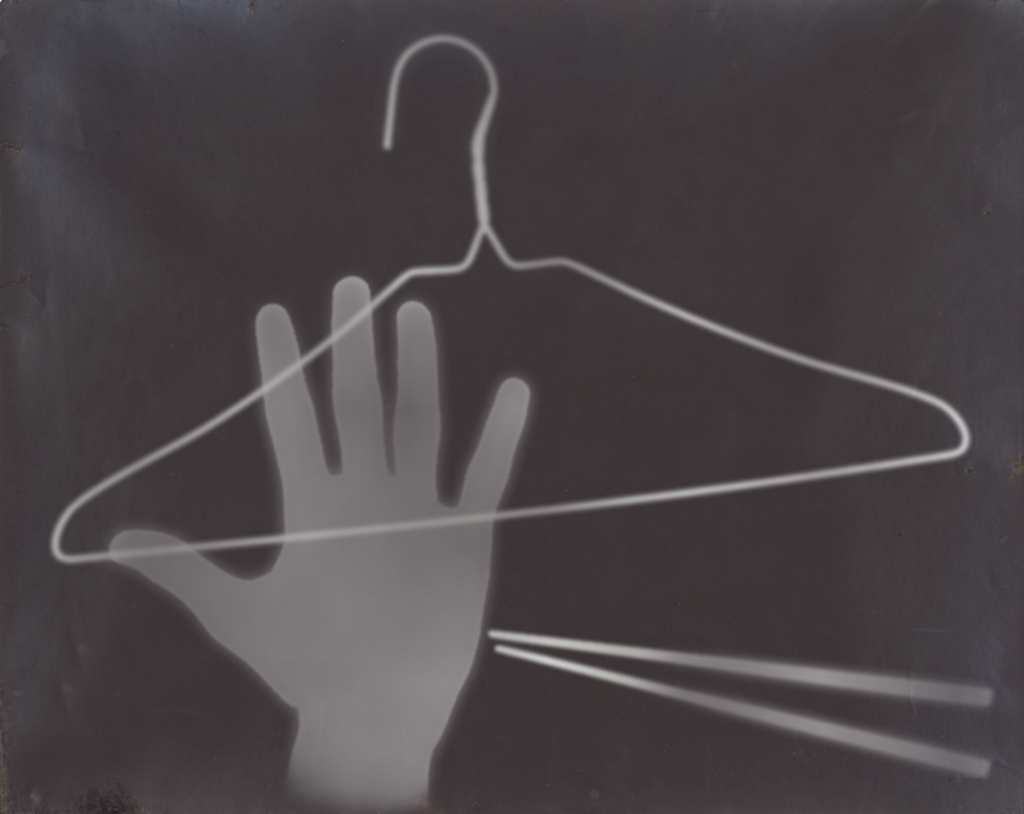
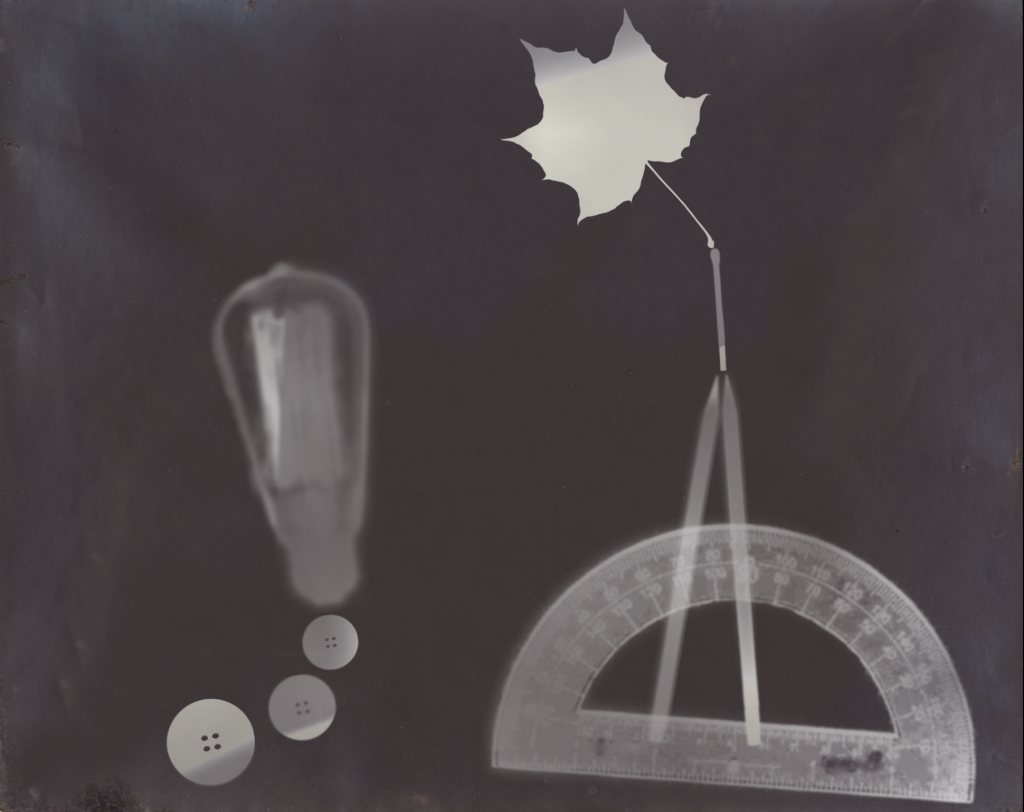
I created an interactive touchscreen application for the Santa Barbara Museum of Art that enabled museum patrons to construct their own camera-less images (photograms) in the style of Laszlo Moholy-Nagy, then upload the results to social media. There were nearly a thousand finished submissions, which can be viewed in this Flickr album. Here are a few of the results:

picasion.com_cb087fc5652f729f41118d9ed4145894

It was very interesting trying to strike a balance between a simple and intuitive interface, while allowing enough depth for more subtle artistic expression (i.e. “low-floor, high-ceiling”). Based on how I observed people using it, it seems to have been relatively effective in this regard. Some users would create a photogram from start to finish in only 20 seconds, while other users would refine the placement of their objects for 15 minutes or more.

DSCF1435

DSCF1296sbma3

Art Code

Photogram Simulation for SBMA

Screen Shot 2015-06-04 at 11.39.51 PMHere are a few screenshots of an interactive app I’m installing for an upcoming exhibition in the Santa Barbara Museum of Art. The show is called The Paintings of Moholy-Nagy: The Shape of Things to Come. I’m trying to create a realistic simulation of a “photogram,” or an image made by placing objects directly over light sensitive paper. Users will use a touch-screen to place and rotate the various objects before “exposing” them to create the finished photogram. The results are starting to look more convincing, although there’s still a bit of work to perfect regarding layering and the simulated perspective shifts. Everything is done in Canvas/Javascript.

Screen Shot 2015-06-04 at 11.39.33 PMScreen Shot 2015-06-04 at 11.34.05 PM


Art Code Voice of Sisyphus

VOS going to Shanghai

vos

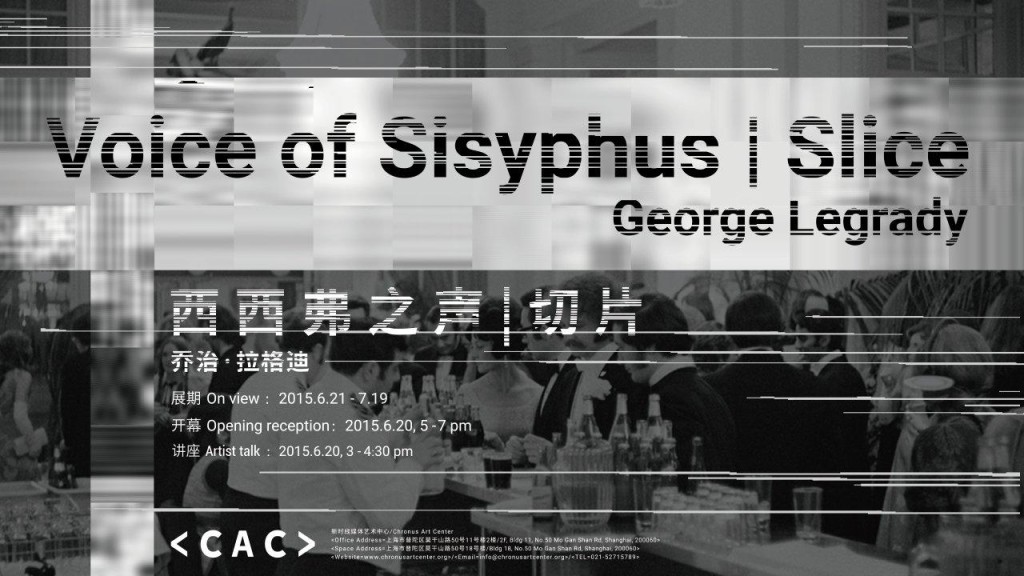
Voice of Sisyphus will be shown at the Chronus Art Center in Shanghai starting in June. I developed the compositional software which controls the piece.

Art Code

Harold Cohen’s Coloring Algorithm in C++

Harold Cohen’s coloring formula is a heuristic method by which to probabilistically control randomly generated color saturation, and lightness values.It has been used extensively by his AARON algorithmic painter, and is summarized in detail in the essay “Color, Simply,” 2006. I ported the algorithm into a C++ as a class which you can download here (relies on AlloCore currently. A standalone version is soon to come).
The algorithm can be described as follows:

  1. Three normalized number ranges are chosen, corresponding to low, medium, and high values. For example 0.15-0.35 (L), 0.4-0.65 (M), 0.8-1.0 (H)
  2. These are set up in a 3×3 matrix, each corresponding to a possible saturation-lightness pairing. For example, a low-low (LL) pairing would provide both saturation and lightness values chosen randomly from within the low range
  3. During initialization, a probability value is assigned to each of the 9 pairing possibilities inside of this matrix. Cohen suggests only using 2-3 of them per composition, for example: 20%-LL, 40%-HL, and 40%-MH
  4. When a new color is desired, one of these range pairs is selected based on its assigned probability, and then a specific saturation-lightness pair is chosen randomly from within each of the selected pair’s ranges.
Code DSP Tutorial

Linkwitz-Riley Filters

If you’re trying to split an audio signal into three frequency bands without using a costly FFT, the Linkwitz-Riley Crossover technique is a great solution. A Linkwitz-Riley filter is just two identical butterworth filters in series (because of that it’s sometimes called the “Butterworth Squared” filter), which has the unique identity of a perfectly flat crossover point. This means that if you pass a signal through a low-pass and a high-pass version and add the result, you’ll basically get back your original signal (all-passed).
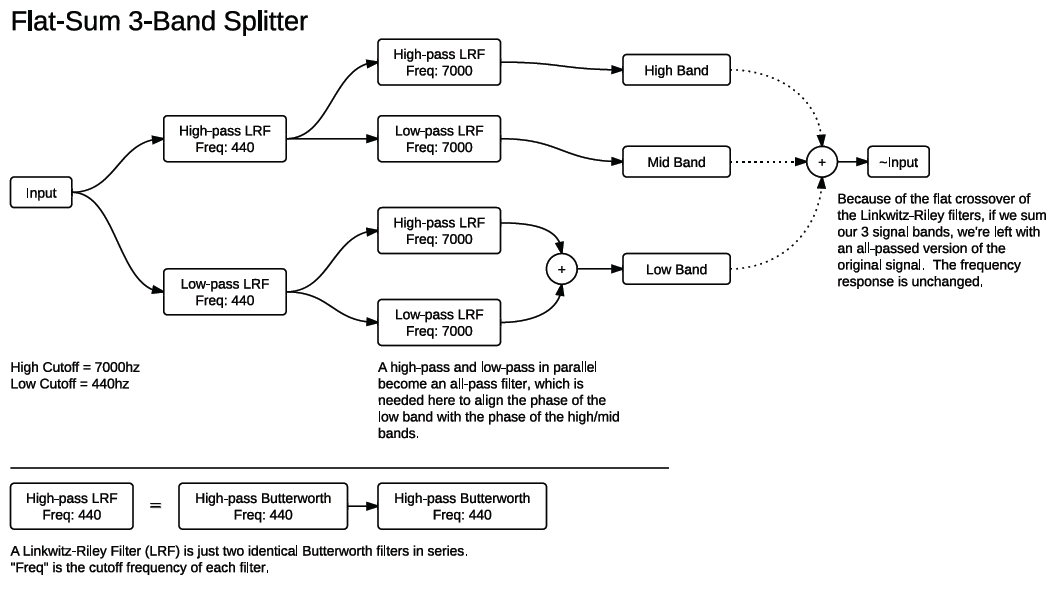
This is a schematic of a 3-band splitter using this principle. Basically, one audio signal is being split in half and then split in half again, giving us 3 separate bands. The only weird thing on the diagram is the two filters in parallel on the low band. These are necessary to align the phase of the bottom with the top two bands. Every time a signal passes through one of these LR filters it gets its phase shifted, so if the bottom band only goes through one filter and the top two bands go through two (one initial and one after the split) then they’ll be out of phase with the bottom and you get bad dips and peaks in the frequency response.

Many, many thanks to Robin Schmidt, a.k.a. RS-MET for help with this tutorial.